Mixing in Contagion Processes

Segismundo S. Izquierdo, Luis R. Izquierdo & Dunia López Pintado

How to install the model

To use MiCoPro (Mixing in Contagion Processes), you will have to install NetLogo 6 (free and open source) and download this zip file. The zip file contains the model itself (micopro.nlogo) and also this very webpage (which contains a description of the model). To run the model, you just have to click on the file micopro.nlogo.

The model

We use bold green fonts to denote variables in the model. The value of many variables can be set by the user by modifying the corresponding slider in the interface of the model.

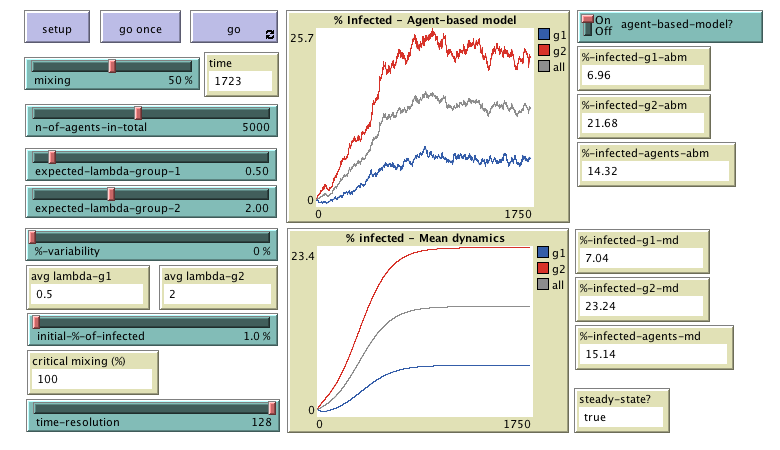
MiCoPro is an agent-based model designed to analyze the consequences of mixing two groups of agents that have different predispositions to adopt a certain trait (or infection). Each individual agent is in one of two possible states: infected or susceptible. In the model there are n-of-agents-in-total agents. Half of them belong to one group and the other half to the other group. The two groups differ in their members' expected propensity to become infected.

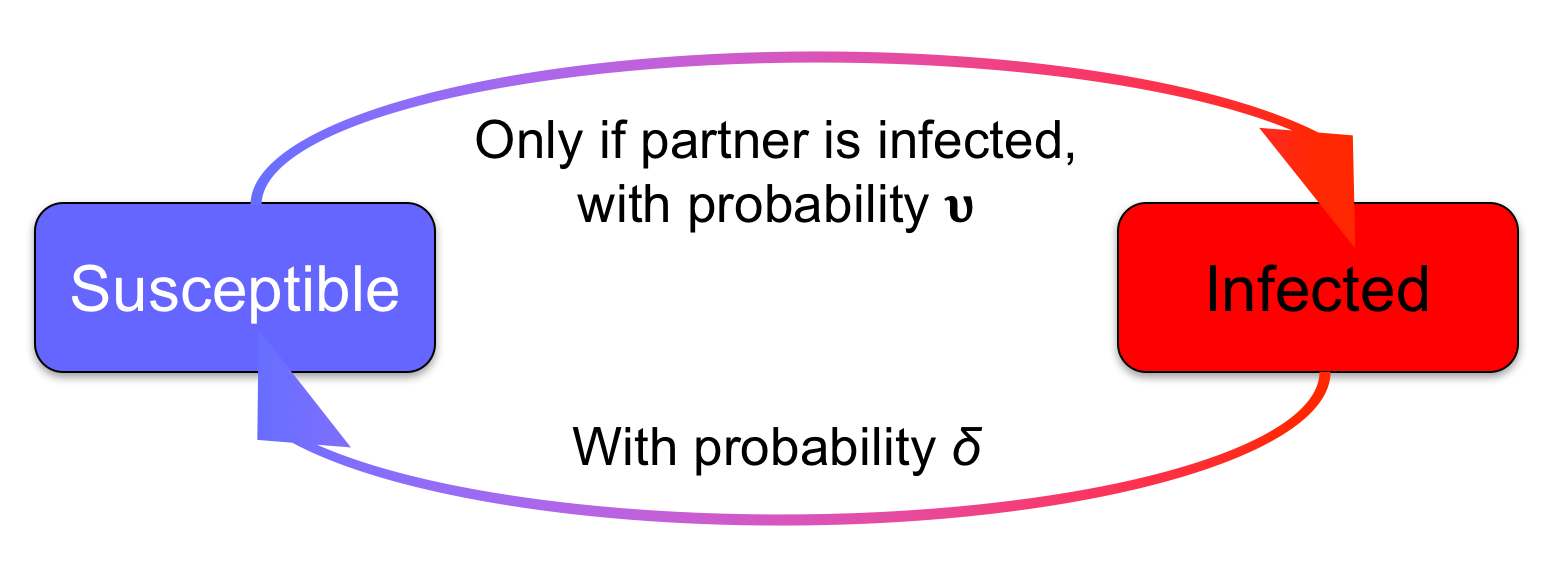
Initially, the percentage of infected individuals in each group equals initial-%-of-infected. The simulation runs in discrete time-steps called ticks. Within each tick the following sequence of events takes place:

  1. In each group, a fraction p of agents is selected to be matched.
  2. Selected agents are matched in a way that guarantees that the percentage of intergroup couples (i.e. couples with partners belonging to different groups) is equal to the value of the parameter mixing.
  3. Susceptible agents become infected only if their partner is infected, and in that case they do so with probability υagent. Infected agents become susceptible with probability δagent.

This sequence of events is repeated iteratively.

Each individual agent is either Susceptible or Infected. The arrows represent the (stochastic) transitions from one state to the other. Their label indicates the event that causes the agent to switch states

The mean dynamics approximation

The program also computes and displays the expected motion of the agent-based model described above, ignoring the heterogeneity in the values of υagent,i and δagent,i within each group i ∈ {1, 2}. The expected motion is sometimes called the mean dynamics or the mean field of the original model, and is expected to be a good approximation of the stochastic evolution of the agent-based model described above, when the population is large. Let ρi denote the fraction of adopters (infected individuals) in group i. If agents within each group present the same probabilities υagent,i = υi and δagent,i = δi, the mean dynamics of this model is:

i / dt = (1 – ρi) p υi [(1 – mixing) ρi + mixing ρj] – ρi δi

where i, j ∈ {1, 2} and i ≠ j.

If we divide the equations above by δi we obtain:

(1 / δi) (dρi / dt) = (1 – ρi) λi [(1 – mixing) ρi + mixing ρj] – ρi

where λi = p υi / δi is the so-called effective adoption rate for group i. Thus, this approximation is simple enough so that the evolution of aggregate adoption can be described with just three relevant parameters: λ1, λ2 and mixing.

Heterogeneity within each group

The agent-based model allows agents within one same group to have different values of λagent,i. This is done by allowing the user to parameterize a uniform distribution of values for λagent,i within each group. Specifically, agents within group i are created with a value of λagent,i drawn from the uniform distribution:

Uniform [ min = expected-lambda-group-i · (1 - %-variability / 100) , max = expected-lambda-group-i · (1 + %-variability / 100) ]

To be precise, the value of p is set to 2-1 and the value of δagent,i is set to 2-5 for every agent. The value of υagent,i for any specific agent in group i is drawn from the uniform distribution:

Uniform [ min = E( υagent,i ) · (1 - %-variability / 100) , max = E( υagent,i ) · (1 + %-variability / 100) ]

where:

E( υagent,i ) = expected-lambda-group-i · δagent,i / p = expected-lambda-group-i · 2-5 / 2-1

This implies that the value of λagent,i within each group follows the aforementioned distribution:

Uniform [ min = expected-lambda-group-i · (1 - %-variability / 100) , max = expected-lambda-group-i · (1 + %-variability / 100) ]

The values of υi in the mean dynamics equations are taken to be the (ex-post) average values of υagent,i across all the agents in group i.

How to use the model

Parameters

  • n-of-agents-in-total: Total number of agents.
  • initial-%-of-infected: Initial percentage of infected agents (in both groups, and in total).
  • mixing: Percentage of intergroup matches (i.e. couples with partners belonging to different groups).
  • expected-lambda-group-1, expected-lambda-group-2, and %-variability: Parameters that specify the distribution of λagent,i within each group. See section Heterogeneity within each group.
  • agent-based-model?: Turn this switch on if you want to run the agent-based model, or turn it off if you just want to run the mean dynamics. In this latter case the simulation runs significantly faster.
  • time-resolution: The mean dynamics is an ordinary differential equation (ODE). This ODE is solved numerically using the Euler method. Parameter time-resolution is the inverse of the step size, i.e. the number of segments (of equal length) in which one time unit is divided.

Buttons

  • setup: Resets all the variables and creates a new population of agents.
  • go once: Pressing this button will run the model one time-step only.
  • go: Pressing this button will run the model until this same button is pressed again.

Monitors

  • time: Number of time-steps (or ticks) that have gone by.
  • avg-lambda-g1: Average value of λagent in group 1
  • avg-lambda-g2: Average value of λagent in group 2
  • critical-mixing: Threshold value for parameter mixing. Assuming critical-mixing < 100 %, if mixingcritical-mixing the infection is expected to die out in the long term. The value of critical-mixing is computed using the mean dynamic approximation.
  • %-infected-agents-g1-ab: Percentage of infected agents in group 1, in the current time-step in the agent-based model.
  • %-infected-agents-g2-ab: Percentage of infected agents in group 2, in the current time-step in the agent-based model.
  • %-infected-agents-ab: Percentage of infected agents in the current time-step in the agent-based model.
  • %-infected-agents-g1-md: Percentage of infected agents in group 1, in the current time-step in the mean dynamics approximation.
  • %-infected-agents-g2-md: Percentage of infected agents in group 2, in the current time-step in the mean dynamics approximation.
  • %-infected-agents-md: Percentage of infected agents in the current time-step in the mean dynamics approximation.
  • steady-state?: This monitor displays the value true if the mean dynamics have reached a steady state; otherwise it displays false. It is considered that a steady state has been reached if and only if the value of %-infected-agents-md in the current time-step, 50 ticks before, and 100 ticks before, differ less than 0.001.

Plots

  • % Infected - Agent-based model: For the agent-based model, this plot shows the time series of the percentage of infected agents in group 1 (g1, in blue), in group 2 (g2, in red) and in total.
  • % infected - Mean dynamics: For the mean dynamics approximation, this plot shows the time series of the percentage of infected agents in group 1 (g1, in blue), in group 2 (g2, in red) and in total.

License


MiCoPro (Mixing in Contagion Processes) is a model designed to analyze the consequences of mixing two groups that have different predispositions to adopt a certain trait (or infection).

Copyright (C) 2018 Luis R. Izquierdo, Segismundo S. Izquierdo & Dunia López Pintado

This program is free software; you can redistribute it and/or modify it under the terms of the GNU General Public License as published by the Free Software Foundation; either version 3 of the License, or (at your option) any later version.

This program is distributed in the hope that it will be useful, but WITHOUT ANY WARRANTY; without even the implied warranty of MERCHANTABILITY or FITNESS FOR A PARTICULAR PURPOSE. See the GNU General Public License for more details.

You can download a copy of the GNU General Public License by clicking here; you can also get a printed copy writing to the Free Software Foundation, Inc., 51 Franklin Street, Fifth Floor, Boston, MA 02110-1301, USA.

Contact information:
Luis R. Izquierdo
University of Burgos, Spain.
e-mail: lrizquierdo@ubu.es

Paper


Mixing and diffusion in a two-type population
Izquierdo, S.S., Izquierdo, L.R. & López-Pintado, D. (2018). Royal Society Open Science, 5(2) 172102.
[Download] | [Presentation] | [Mathematica demonstration] | [Video (Spanish)]


Copyleft © Luis R. Izquierdo, Segismundo S. Izquierdo & Dunia López Pintado 2018
Based on Flatfly template