To use InDyTeRRoD, you will have to install NetLogo 5.3.1 (free and open source) and download the model itself. Unzip the downloaded file and click on indyterrod.nlogo
InDyTeRRoD (Industrial Dynamics and Technological Regimes and the Role of Demand) is an evolutionary model designed to explore industrial dynamics in alternative technological regimes. The model incorporates entry/exit mechanisms, innovation, imitation, competition, strategic learning and firm growth in an innovative industry.
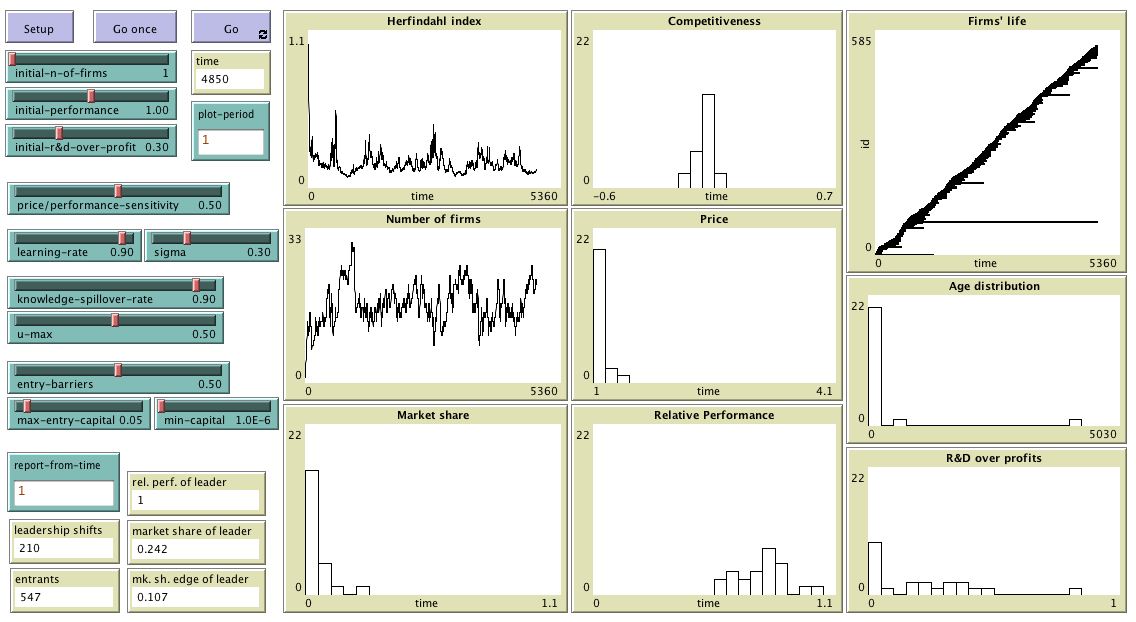
This section explains the formal model that InDyTeRRoD implements. The information provided here should suffice to re-implement the same formal model in any sophisticated enough modelling platform. We use bold red italicised arial font to denote parameters and initial conditions (i.e. variables that can be set by the user), and we use bold green italicised arial font to denote the name of the corresponding slider or box in the interface of the model above. All sliders can be changed at run-time with immediate effect on the dynamics of the model (except initial conditions).
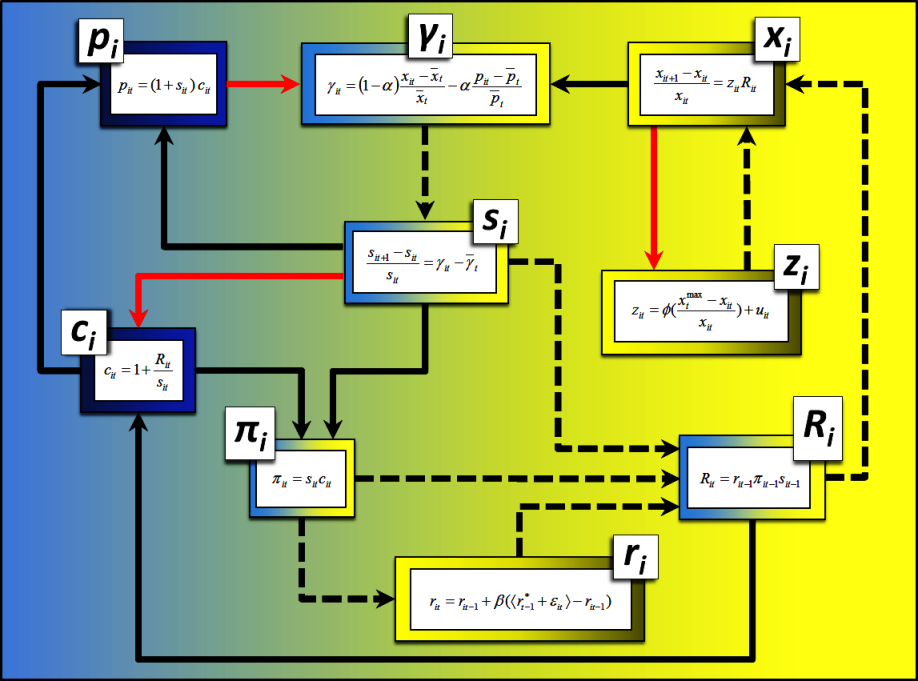
The figure below summarizes the main interactions among the variables in the model; it is a helpful reference to look at whilst reading the explanation of the model.
Overview of the interactions among the variables in the model. The variables that are more closely related to costs and prices are placed on the left, whilst the variables more related to the processes of innovation and performance improvement appear towards the right. A solid black arrow from X to Y denotes that an increment in variable X implies an immediate increment in variable Y. A dashed black arrow implies that the positive influence is not immediate, but it is delayed one time step. A solid red arrow from X to Y denotes an immediate negative influence, i.e. that an increment in variable X implies an immediate decrement in variable Y.
As an example, identify the following two negative feedback loops in the figure. The first one favors the stability of the variable performance xi, whilst the latter favors the stability of competitiveness γi):
In order to simplify the model's presentation, we classify our assumptions into six subsections: "The Firms' Competitiveness", "Demand Transformation", "Production", "R&D Spending", "Product Innovation" and "Exit and Entry of firms".
At any time there are nt firms (indexed in i = 1,...,nt) competing in an innovative industry. We assume that firms compete over price pit and product performance xit (quality, reliability, size, speed, precision). Firms set prices applying a margin to the unit cost cit equal to their individual market share sit (larger margins for greater market powers). Thus,
pit = (1 + sit)·cit
Thus, firm i's unit profit is
πit = pit - cit = sit·cit
Regarding performance xi, we will establish below how firms improve their products through R&D-based technological innovations. For now, given the vector (pit, xit) we can define the level of competitiveness of firm i's product (as consumers perceive it in the global market) in the following way:
γit = (1-α)·(xit-xt)/xt - α·(pit-pt)/pt
where xt = ∑jxjt/nt and pt = ∑jpjt/nt.
This formula captures the fact that consumers value both high levels of performance and low prices. The subjective relativity implied by the terms "high" and "low" is quantified using the average across the different products, whilst the trade-off between performance and price is regulated by parameter α (the price/performance-sensitivity of demand).
Production and growth are demand-driven. Regarding the demand-side of the market, we consider that the global demand (Qd) is constant and equal to 1. As si is the proportion of global demand supplied by firm i -that is, its market share- we can see that the instantaneous demand of firm i will be equal to its market share:
Qdit = sit·Qd = sit
If we consider that the consumers interact among themselves, observing each other and disseminating information regarding prices and performances of different products, we can assume that there will be a gradual process of demand transformation. That is, consumers will withdraw their demand from certain firms and pass it on to others with a higher level of competitiveness γit. Fatas-Villafranca et al. (2011) propose explicit evolutionary microfoundations to capture this kind of processes, and obtain a typical replicator dynamics expression. Along these lines, and drawing also on Metcalfe (1998), we propose that this process of demand transformation can be represented by:
(sit+1-sit)/sit = γit-γt
where γt = ∑jsjtγjt.
It is then clear that those firms with higher than average levels of competitiveness will tend to capture a greater proportion of the demand.
Let us see how production and growth fit the evolution of demand. Starting out from a supply-demand equilibrium for each firm Qdi0 = Qsi0, we assume that each firm's growth rate follows the growth rate of its demand. Hence, if we assume that all firms produce in accordance with technology:
Qsit = Kit
where Kit is firm i's capital, the following must be fulfilled:
gkit ≡ (Kit+1-Kit)/Kit = gsit ≡ (Qsit+1-Qsit)/Qsit = gdit = (sit+1-sit)/sit
That is, the growth of physical capital Kit -and, therefore, of the output- in each firm fits the growth of its demand in such a way that, at all times, Qdit = Qsit is fulfilled. Moreover, it is clear that ∑jKjt = 1, and therefore sit = Qit = Kit.
We assume that firms spend on R&D activities a proportion ri ∈ [0,1] of the profits obtained in the previous period:
Rit+1 = rit·πit·Qit
Clearly, rit is a firm-specific operating routine. According to Silverberg and Verspagen (2005), deciding the most convenient level of has traditionally been considered as an uncertain strategic choice. Therefore, instead of assuming that rit is calculated by applying any optimizing procedure, we will consider that firms adapt this proportion by trying to approach the routine of their most successful rival in a certain percentage β ∈ [0,1] (learning-rate). We also include a stochastic component εit ∼ N(0,σ) to model possible imprecisions in the observation of the target competitor's routine. More precisely, we will consider that firms update rit according to the following expression:
rit+1 = rit + β·( <rt* + εit> - rit)
where rt* denotes the R&D routine of the most profitable firm at time t, β ∈ [0,1] is the learning-rate, εit ∼ N(0,σ) is a random variable that follows a normal distribution of mean equal to 0 and standard deviation equal to σ (sigma), and <·> is a clipping function that returns the argument clipped in the interval [0,1].
Thus, firm i's unit cost will be:
cit = 1 + Rit/Qit = 1 + rit-1πit-1Qit-1/Qit
Along the lines in Nelson (1982), we assume the following equation to model the rate of improvement in each firm product performance:
(xit+1-xit)/xit = zit·Rit
where zit can be identified with the productivity of R&D, and is determined as follows:
zit = Φ·((xmaxt - xit)/xit) + uit.
where Φ ∈ [0,1] is the knowledge-spillover-rate, xmaxt is the maximum performance in time t, and uit ∼ Λ(umin=0,umode=0,uMax) is a random variable that follows a triangular distribution of minimum value equal to 0, mode value equal to 0, and maximum value equal to uMax (u-max).
Any firm i whose capital Kit falls below a minimum quantity min-capital exits the market. On the other hand, new firms can enter the market. In every time step, we assume that there exists a certain probability that -at most- one new firm entries into the sector. We assume that such a probability is higher, the bigger the maximum profit in the sector. Specifically, we consider that the probability of this event is:
P(Et=1) = (1-λ)·πmaxt / (1+πmaxt)
where Et is a random variable that represents the number of new entrants (either 0 or 1) at time t, λ ∈ [0,1] is the entry-barriers, and πmaxt represents the maximum profit achieved by a firm in t.
Additionally, we suppose that the new entrant will have an initial capital given by Kn+1 ∼ U(0,max-entry-capital) where max-entry-capital is an exogenous parameter, and U denotes the continuous Uniform probability distribution. Let us note that, after assigning the initial capital to the new entrant, all capitals are normalized, so they all add up to one. Thus, at all times any firm's capital is equal to its market share. Finally, we assume that the new entrant chooses randomly one of the existing incumbent firms to replicate its level of performance, and its R&D over profits ratio. The probability of an incumbent to be selected for replication is proportional to its market share.
InDyTeRRoD (Industrial Dynamics, Technological Regimes and the Role of Demand) is an evolutionary model designed to explore industrial dynamics in alternative technological regimes.
Copyright (C) 2011 Isabel Almudí, Francisco Fatás & Luis R. Izquierdo
This program is free software; you can redistribute it and/or modify it under the terms of the GNU General Public License as published by the Free Software Foundation; either version 3 of the License, or (at your option) any later version.
This program is distributed in the hope that it will be useful, but WITHOUT ANY WARRANTY; without even the implied warranty of MERCHANTABILITY or FITNESS FOR A PARTICULAR PURPOSE. See the GNU General Public License for more details.
You can download a copy of the GNU General Public License by clicking here; you can also get a printed copy writing to the Free Software Foundation, Inc., 51 Franklin Street, Fifth Floor, Boston, MA 02110-1301, USA.
Contact information:
Luis R. Izquierdo
University of Burgos, Spain.
e-mail: lrizquierdo@ubu.es
This program has been designed by Isabel Almudí, Francisco Fatás & Luis R. Izquierdo, and implemented by Luis R. Izquierdo.